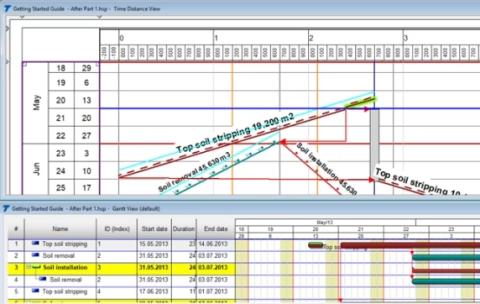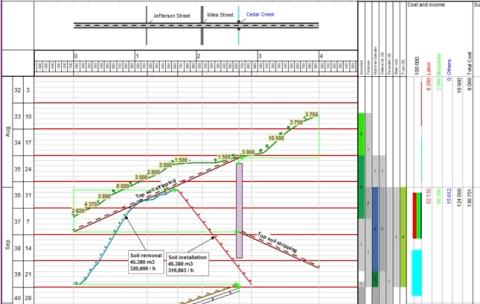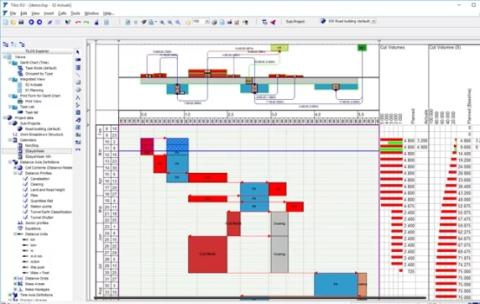
- Use time-distance diagrams to map out a linear schedule
- Support "what if" scenarios within the scheduling overview
- See equipment, materials, costs, timelines and budgets in one Gantt chart
- Reduce risk and planning mistakes with time chainage

- Link activities to save time
- Gantt charts grouped by location and by company
- Combines Gantt schedules, construction site plans, heights, earth mass handling, scales, histograms all in one view
- Print your schedules with the level of detail intact using PDF and SVG files
- Annotate images with comments

- Detect conflicts utilizing project management tools alongside your schedule
- Detailed overview of work progress and percent of project completed
- Location-based progress tracking shown in time and distance
- See if your project is either on time, ahead of schedule or with delays